

You know the feeling when a clinician asks, “Can we prove this treatment is working?” or when leadership wants lower readmissions, and your EHR has mountains of notes, labs, and claims, but no clear story? If you’ve ever spent hours pulling reports only to find conflicting numbers, you’re not alone. Clinical data analysis turns messy, real-world healthcare data into decisions you can actually defend. “One of the most important benefits of healthcare data analytics is its ability to improve patient outcomes.
Clinical Data Analysis: What It Is and What It Isn’t
Let’s cut through the jargon. Clinical data analysis is the process of turning patient-level clinical data into measurable insights that improve outcomes, safety, and care delivery. It’s not just “reporting” or generic “data analytics.”
Unlike operational analytics, which focuses on staffing and throughput, or financial analytics, which tracks revenue cycles, clinical data analysis bridges bedside reality with evidence-based decisions.
Think of it as translating your patients’ stories into a universal language that connects care, billing, and decision-making. When done right, it helps you spot health trends before they become crises, personalize treatments, and prove what’s actually working in your practice.
The 3 Data “Worlds” You’re Analyzing
Your clinical data comes from three main sources, and they rarely agree perfectly. First, there’s EHR clinical data, including notes, vitals, labs, medications, and diagnoses. Second, you’ll work with administrative and claims data covering CPT codes, ICD codes, DRG classifications, and authorizations. Third, patient-generated data from wearables, remote monitoring devices, and patient-reported outcome measures adds another layer.
The challenge isn’t collecting this data; it’s reconciliation. When these sources conflict, you need a clear source-of-truth decision before you start any analysis. Which dataset wins when they disagree? Make this choice upfront, or your insights will be meaningless.
Now that we’ve defined what clinical data analysis actually means, let’s see where it shows up in your daily healthcare workflows.
Where Clinical Data Analysis Shows Up in Real Healthcare Workflows
Clinical data analysis isn’t just theory; it’s actively changing how healthcare teams make decisions every day. The key is mapping specific applications to real teams and daily decisions rather than talking about benefits in the abstract.
Patient Care Decisions
Clinical teams use data analysis for early deterioration signals, sepsis flags, and medication safety monitoring. The trick isn’t building the perfect model; it’s managing alert burden and ensuring clinical adoption. A high-accuracy algorithm means nothing if nurses ignore the alerts because there are too many false positives.
Start with one unit as a pilot. Track alert acceptance rates and time-to-action, not just technical performance metrics. This approach gives you real-world validation before scaling across your organization.
Quality & Safety
Clinical data analysis drives hospital-acquired infection reduction, falls prevention, pressure injury monitoring, and mortality tracking. Here’s what most people miss: variation analysis by unit, provider, or shift often delivers faster wins than implementing flashy AI solutions.
Run a simple stratification analysis comparing outcomes by unit and patient acuity. You’ll often find actionable patterns that don’t require complex modeling or expensive technology investments.
Population Health & Value-Based Care
Risk stratification, preventive screening gaps, and social determinants of health-informed outreach rely heavily on data analysis. But SDoH data only improves outcomes if you define clear action pathways. Who makes the calls? What resources do you offer? When do interventions happen?
Before building predictive models, try adding “last visit date plus missed screenings” to your outreach lists. This simple approach often yields immediate improvements in care coordination.
Clinical Operations
Length of stay drivers, readmission patterns, discharge barriers, and ED boarding issues all benefit from clinical data analysis. Many operational problems that appear clinical are actually documentation or timestamp integrity issues.
Start by validating basic event timestamps like admit orders, bed assignments, and discharge orders. Clean data foundations matter more than sophisticated analytics in operational settings.
With these workflow applications in mind, let’s walk through the systematic process for reliable clinical insights.
The Clinical Data Analysis Lifecycle
Every successful clinical data analysis project follows a six-step lifecycle that ensures reliable, auditable insights. This isn’t about analytics types—it’s about building a process that works in production.
Start with the Clinical Question
Convert vague requests like “reduce readmissions” into measurable hypotheses with clear decision thresholds. What risk score triggers action? What intervention gets deployed? Write the decision rule first, then build your metrics and models around that framework.
Data Preparation That Actually Matters
Healthcare data requires special attention to missingness patterns, duplicate records, time windows, and encounter definitions. How you define an “index encounter” versus “episodes of care” can dramatically change your results.
Standardize three key elements upfront: index encounter definition, lookback window timeframe, and follow-up window duration. Document these choices because they’ll impact every analysis downstream.
Choose Analysis Methods That Fit the Decision
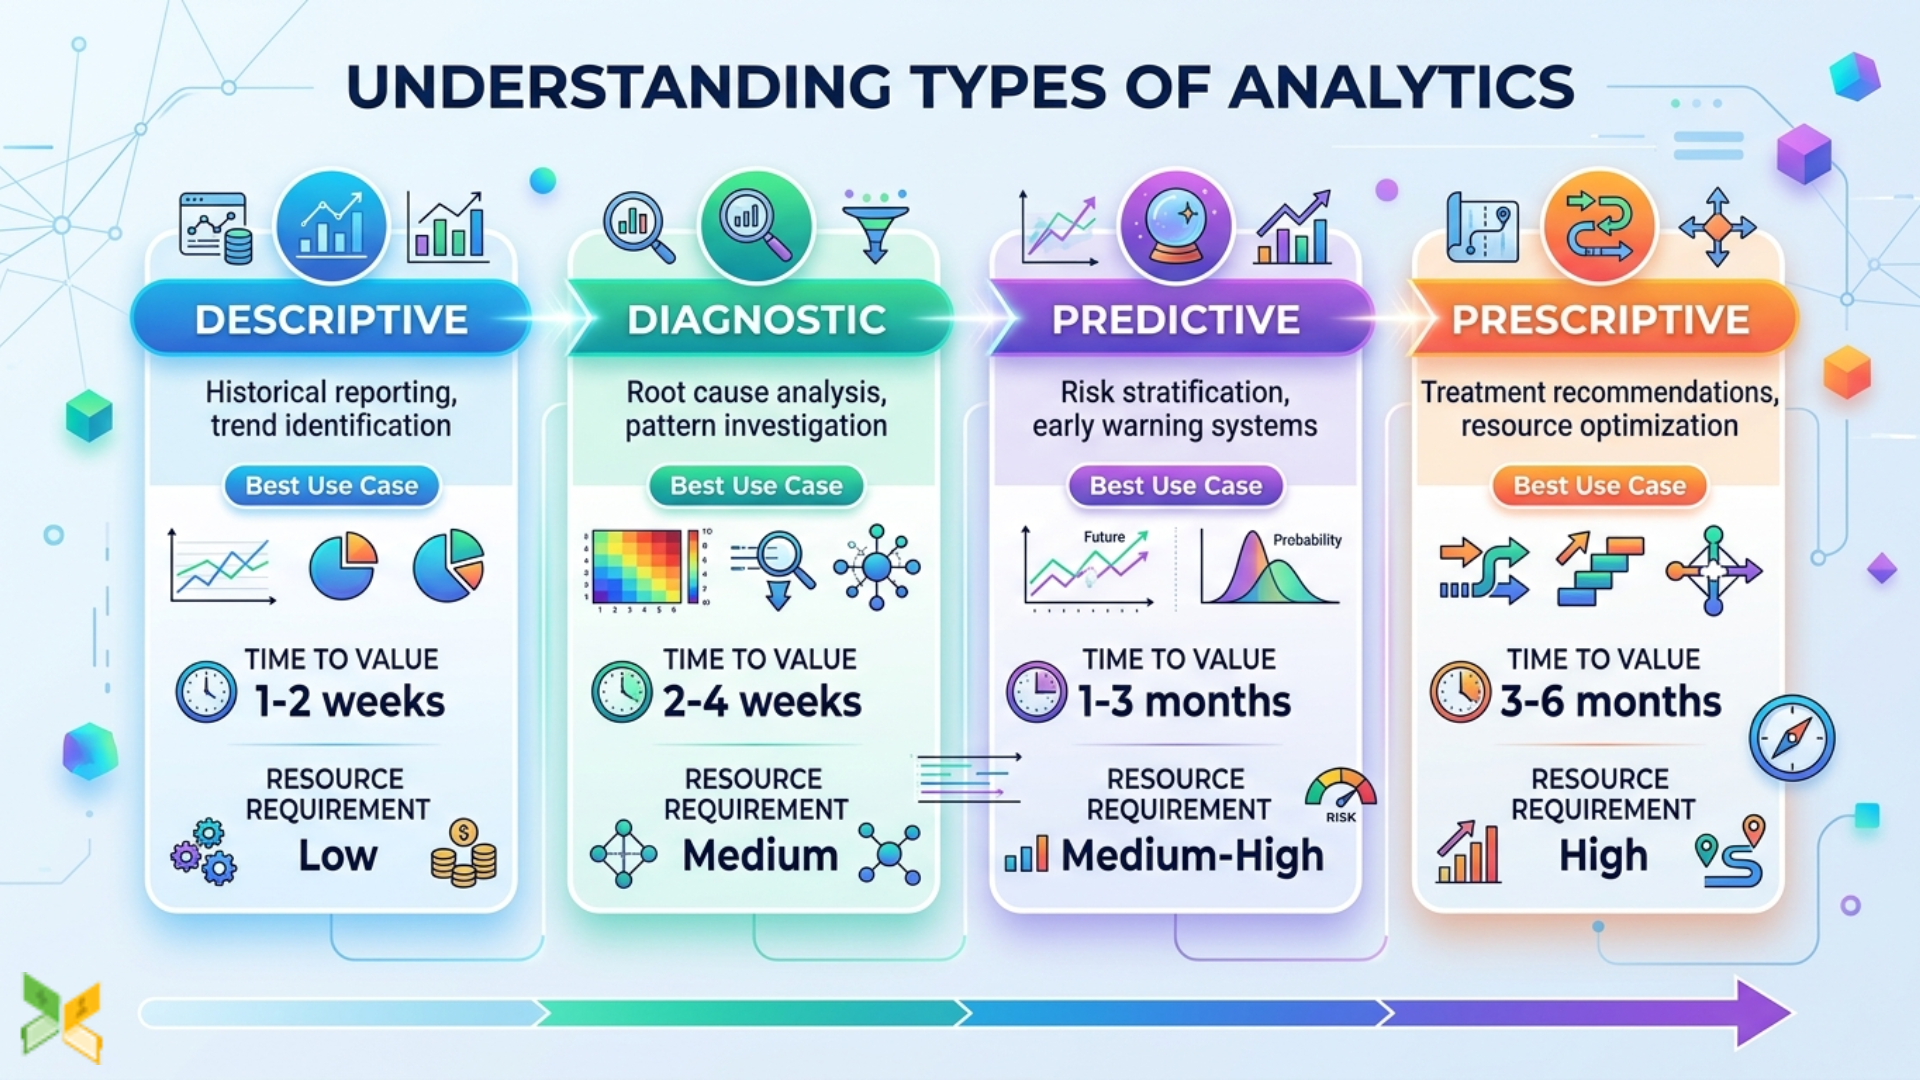
Match your analytical approach to the decision context. Descriptive analytics answers “what happened,” diagnostic analytics explains “why it happened,” predictive analytics forecasts “what’s next,” and prescriptive analytics recommends “what to do.”
If your organization can’t execute prescriptive recommendations, stop at predictive insights with clear playbooks for action.
Validation & Clinical Sense-Checking
High AUC scores can still be clinically unsafe. Calibration and subgroup performance matter more than overall accuracy metrics. Always validate results by age group, sex, race and ethnicity, and comorbidity burden.
Clinical plausibility reviews with frontline staff catch issues that statistical validation misses.
Delivery Methods That Change Care
Dashboards don’t improve outcomes unless they’re tied to regular review cadence and clear accountability structures. Assign metric owners, establish review schedules, and create escalation pathways for concerning trends.
Monitoring for Drift and Outcomes
Data drift, model drift, workflow changes, and coding updates can all undermine your insights over time. Set monitoring triggers for things like readmission rate changes or missing data spikes.
This systematic approach helps you avoid common pitfalls, but success also depends on choosing the right data sources.
Data Sources You’ll Use and How to Avoid Expensive Mistakes
Your insights are only as good as your data sources. Understanding the strengths and limitations of each source prevents costly errors and unreliable conclusions.
EHR Data: Powerful but Messy
Electronic health record data offers rich clinical detail but comes with significant challenges. Lab values without units or reference ranges can be dangerously misleading. Always store lab unit, reference range, and collection time alongside the actual values.
Documentation variation between providers creates inconsistencies that can skew analysis results. Build a clinical data dictionary with clinician input before scaling any EHR-based analysis.
Coding and Claims Data: Great for Scale, Risky for Clinical Nuance
Claims data reflects billing rules and documentation practices, not always clinical reality. It’s excellent for cohort identification and utilization analysis but risky for clinical severity assessments.
Use claims data for population-level insights and EHR data for clinical details. This approach gives you the scale benefits of claims with the accuracy of clinical documentation.
Imaging and Waveforms: The Next Competitive Edge
Multimodal analytics combining imaging, continuous monitoring, and clinical notes represents the frontier of clinical data analysis. Start with one high-yield data stream like continuous SpO₂ trends before tackling complex imaging AI projects.
This focused approach builds competency and demonstrates value before major technology investments.
Your data sources set the foundation, but the right tools make analysis practical and scalable.
Tools and Technologies for Clinical Data Analysis
Tool selection should match your organizational constraints around speed, compliance, interoperability, and staffing rather than following technology trends.
Quick-Win Stack for Small Teams
SQL databases combined with Excel or Google Sheets for manipulation and Power BI or Tableau for visualization can deliver immediate value. This stack requires minimal training and works within most IT security frameworks.
Build reproducible SQL views for your top three metrics. This foundation supports more sophisticated analysis as your capabilities grow.
Scalable Stack for Enterprise
Cloud data warehouses with tools like dbt for transformation, semantic layers for consistent definitions, and governed BI platforms support organization-wide analytics programs. The key is creating single semantic definitions for critical metrics like readmission rates.
Lock in standard definitions early. Changing them later disrupts historical trending and team confidence in your insights.
AI and NLP for Clinical Notes
Natural language processing extracts value from unstructured clinical notes for problem list generation, adverse event detection, and phenotyping. Success comes from precision in definitions, not model complexity.
Pick one specific concept, like smoking status or heart failure exacerbation. Validate extraction accuracy with chart review before expanding to additional concepts.
These tools need proper governance frameworks to ensure compliance and security.
Privacy, Security, and Compliance in Clinical Data Analysis
Compliance must be built into your workflow from the start, not added as a final approval step. This approach prevents delays and reduces security risks.
De-identification and Data Minimization
Remove direct identifiers and aggregate data when patient-level detail isn’t necessary for your analysis. Follow the minimum necessary principles for every data request.
Interoperability and Governance
Data silos often result from governance decisions rather than technical limitations. Establish cross-functional data governance teams, including clinical, IT, compliance, and quality stakeholders.
Clear governance enables broader data sharing while maintaining security and compliance standards.
Success in clinical data analysis requires measuring the right outcomes at the right intervals.
What “Good” Looks Like: Metrics for Success
Track both leading indicators that predict success and lagging indicators that confirm impact.
Leading Indicators
Monitor alert acceptance rates, dashboard usage tied to clinical huddles, and time-to-intervention metrics. These predict whether your analytics program will succeed long-term.
Track time saved and actions taken, not just reports produced. Process metrics matter as much as clinical outcomes.
Lagging Indicators
Measure readmission rates, length of stay, complication rates, cost per case, and patient experience data scores. Use pre-post comparisons with control units when possible for reliable impact assessment.
Equity Checks
Add equity analysis to every KPI dashboard by default. Monitor subgroup outcomes, access measures, and bias patterns to ensure your insights don’t perpetuate healthcare disparities.
These metrics guide your evaluation, but getting started requires a structured approach.
Getting Started: A Simple 30-Day Clinical Data Analysis Plan
Focus on one problem, one dataset, and one measurable outcome. “By leveraging data analytics to drive innovation and patient engagement, healthcare organizations can improve patient outcomes and stay competitive in the evolving healthcare landscape” (https://www.thehealthcareexecutive.net/article/2024-leveraging-data-analytics-for-improved-patient-outcomes/).
Week 1: Pick Your Question and Define Success
Choose one high-impact area: readmissions, sepsis response times, missed screenings, or medication reconciliation. Write your success definition before touching any data.
Week 2: Build Clean Data and Validate Definitions
Create your analysis dataset and run 20 chart reviews to validate cohort logic. This validation step prevents embarrassing errors and builds clinical trust.
Week 3: Analyze and Visualize for Action
Build a one-page action dashboard with a maximum of three KPIs. Focus on actionability over visual appeal.
Week 4: Create Feedback Loops
Assign owners, establish review cadence, and set monitoring triggers. Operationalization determines long-term success more than analytical sophistication.
This structured approach addresses common questions about clinical data analysis implementation.
The Future Starts with Your First Analysis
Clinical data analysis transforms healthcare by turning messy clinical data into reliable decisions. Success requires clear definitions, validated data sources, and operationalized insights with dedicated owners and regular review cycles.
The key isn’t perfect technology, it’s building systematic processes that improve patient outcomes through better decision-making. “The future of healthcare is data-driven, and the potential for data analytics to transform patient care is immense”.
Start with one clinical question, standardize one key definition, and launch your 30-day pilot today.
Common Questions About Clinical Data Analysis in Healthcare
1. What is clinical data analysis in healthcare?
Clinical data analysis transforms patient-level clinical data into validated insights for care decisions. It differs from documentation review or generic reporting by focusing on chart-grounded clinical reality rather than operational metrics.
2. Why is clinical data analysis important in healthcare?
Clinical data analysis reduces care variation driven by anecdotal experiences and provider preferences. It creates defensible, evidence-based decisions that improve consistency and quality while reducing hidden costs from variable practices.
3. How is clinical data analysis used in healthcare?
Applications include risk stratification, care pathway adherence monitoring, adverse event detection, and resource planning tied to outcomes. Success requires selecting use cases based on frequency, potential harm, and organizational control.