
You’re running a study, but the data you need is always a step behind. Sites enter EDC late, lab results arrive after the safety call, and your team spends more time chasing queries than making decisions. We’ve all felt that “Are we flying blind?” moment.
Research confirms that when participants feel secure and cared for, adherence to study protocols increases and data quality improves. Real-time data monitoring in clinical research changes that dynamic. Here, you’ll learn what it actually means in practice, how it works across systems, and how to set it up without overwhelming your sites or weakening overall clinical trial monitoring.
Real-Time Data Monitoring Is How You Spot Risk Early
Real-time data monitoring in clinical research means continuously or near-continuously reviewing critical trial data as it’s captured, rather than waiting for weekly listings, monthly check-ins, or database-cleaning cycles. In the real world, “real-time” often means minutes-to-hours latency depending on the source. The key shift is this: you’re managing the trial while it’s happening, not after the damage is done.
Modern tools, including EDC systems, remote monitoring devices, and AI algorithms, can identify potential safety issues faster than traditional methods, enabling researchers to track patient health in real time and automate compliance with regulatory requirements. That’s a meaningful operational shift from periodic review cycles and a major evolution in clinical trial monitoring.
Most competing content focuses on the benefits of this approach but skips the operational reality. If you don’t define what “real-time” applies to, who owns alerts, and what actions are allowed, you’ll build noisy dashboards and burn out your team. Done right, continuous oversight supports RBM, remote oversight, faster issue resolution, and more effective clinical data review without replacing good clinical judgment. What follows is a practical framework you can use to understand, design, and run real-time data monitoring without drowning in data.
A Practical Framework for Real-Time Data Monitoring
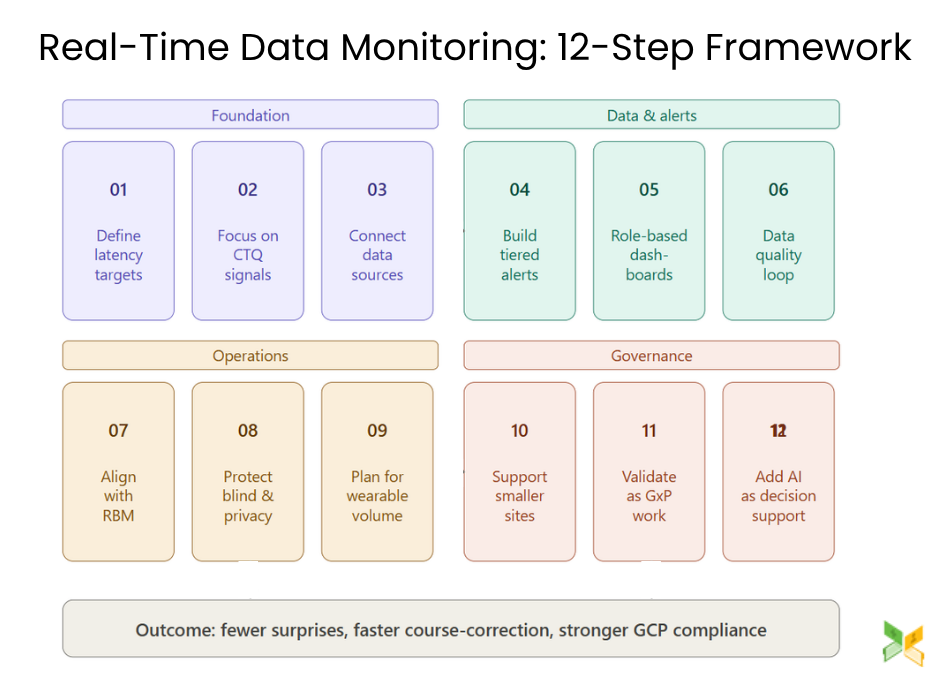
Each element below builds on the one before it, progressing from how you define the concept through how you scale it across technology, people, and compliance.
1. Know What Real-Time Actually Means in Your Trial
“Real-time” isn’t a feature; it’s a service-level expectation. In most trials, a 15-minute EDC refresh is more than enough for operational decisions. What matters is that you define latency targets per data source in your Monitoring Plan and vendor SLAs, and label dashboards with “last updated” timestamps so teams trust what they see.
Latency tiers vary by source: EDC and ePRO can refresh near-continuously, central labs typically run on a nightly schedule, and wearable streams can be truly continuous. Without clear targets, “real-time” stays a vague promise rather than a working SLA.
Once you’ve set latency expectations, the next question is: out of everything you could monitor, what should you actually watch first?
2. Start With the Signals That Prevent the Most Pain
The best real-time programs focus on critical-to-quality (CTQ) factors, not every KPI the system can generate. If every metric is labeled “critical,” none of them are, and your team will simply ignore the dashboard. Pick 8 to 12 CTQs across safety, data quality, and operations: SAE timeliness, missing primary endpoint fields, dosing compliance, and visit window adherence are solid starting points.
Trials with well-implemented risk management plans see drop-out rates decrease, which is exactly why focusing on retention-related CTQs pays off across the whole study. Build a Tier 1 versus Tier 2 metric list before you design a single dashboard view.
3. Connect Your Data Sources So Monitoring Isn’t Siloed
Many real-time failures come from fragmented tooling, where EDC looks fine while ePRO is collapsing or labs are delayed. Map all your sources, including EDC, eCOA/ePRO, RTSM/IRT, central labs, imaging, devices, and eConsent, then define one place for cross-source reconciliation. Integration patterns include API pull, event or webhook push, and SFTP batch with frequent refresh.
Use CDISC standards such as CDASH and SDTM to make sure data from different systems speak the same language. With projections showing 80% fewer traditional sites by 2028 as virtual hubs and home networks dominate, multi-source integration isn’t optional; it’s foundational infrastructure for scalable clinical trial monitoring.
4. Use Alert Rules That Trigger Action, Not Panic
More alerts don’t mean safer trials; they often mean alert fatigue and slower response to real risk. Every alert rule should cover a threshold, a time window, a severity level, an owner, a required response time, and an escalation path. Use a tiered severity model: Info, Warning, and Critical.
Trials with well-implemented adverse event monitoring systems see lower variance in outcomes, and that consistency is only achievable when alert rules are tight enough that teams act on them. Add digest summaries for non-critical items, and consider quiet hours to prevent overnight floods. If an alert doesn’t consistently drive a documented action, redesign it or remove it entirely.
5. Design Dashboards Around Who Uses Them
One dashboard for everyone becomes useful for no one. Operations teams need enrollment velocity, screen failure rates, and visit adherence. Safety physicians need AE/SAE timeliness, lab threshold breaches, and event clustering by site. Data managers need query aging, missingness heatmaps, and edit check failure rates.
CRAs need a dynamic site risk score, deviation patterns, and training compliance flags. Each view should surface the top five actions for that role, support drill-down by site or country, and produce audit-friendly exports. This is what makes clinical trial dashboards valuable: they turn data into action for each stakeholder instead of overwhelming everyone with the same view.
The table below summarizes the key dashboard focus areas by role:
|
Role |
Primary Metrics |
Key Action |
|
ClinOps/CRA |
Site risk score, deviation rate, and visit adherence |
Prioritize SDV and site contact |
|
Safety Physician |
SAE timeliness, lab flags, AE clustering |
Escalate or investigate safety signals |
|
Data Manager |
Query aging, missingness, and edit check failures |
Close queries and enforce data entry timelines |
|
Ops Lead |
Enrollment velocity, screen failure, dropout rate |
Adjust recruitment or site support strategy |
6. Build a Data Quality Loop Before Memory Fades
Real-time value is highest when corrections happen fast, before source documents get harder to verify. Set clear expectations: sites enter key fields within 24 to 48 hours, queries are responded to within three to five days, and exceptions require a documented rationale.
Automated nudges, including ePRO reminders, EDC incomplete-form alerts, and query-aging notifications, keep the loop turning without constant manual follow-up. This corrective cycle is exactly how risk management plans get “well-implemented” in practice and how stronger clinical data review happens before issues compound.
7. Make Real-Time Monitoring Work With RBM
Think of continuous data flows as the input that drives your dynamic site risk score: deviation rate, late EDC entry, AE underreporting indicators, and visit adherence all feed in. That score then prioritizes which sites get SDV, targeted on-site visits, or a check-in call.
For example, two consecutive late SAE reports at a single site should raise a different level of concern than a one-off delay at a new investigator’s site. Central monitoring sharpens resource allocation rather than duplicating it. In practice, these evolving scores function as risk indicators in clinical trials, helping teams focus attention where intervention matters most.
8. Protect the Blind and Patient Privacy From Day One
Real-time visibility can accidentally expose treatment-linked patterns or unnecessary PHI if access permissions aren’t designed early. Enforce role-based access, pseudonymization, and masked views for blinded trials. Document who can see subject-level data and why.
Key regulatory references to build into your system design include 21 CFR Part 11, EU Annex 11, GDPR, and HIPAA. Least-privilege permissions and complete, timestamped audit trails are not optional steps; they’re the difference between a clean inspection and compliance debt.
9. Plan for Data Volume Shock With Wearables
Wearables don’t create endpoints; they create noisy raw streams that must be summarized into clinically meaningful measures before they’re usable. Define upfront what gets stored raw versus summarized, and what triggers a human review.
Useful metrics include time-in-range for CGM, arrhythmia episode counts, and device compliance rates rather than raw continuous output. Set device compliance thresholds so you catch a participant who has stopped wearing a device before the gap becomes a data integrity problem.
10. Keep Smaller Sites Running With Lighter Workflows
Real-time programs fail when they assume every site has equal bandwidth. Give smaller sites a simple rhythm: enter key data within 24 hours, check one site-facing task list, and join a 15-minute review call only if flagged.
Use SSO to cut login friction, and let sponsor or CRO portals carry the technical complexity centrally rather than pushing it to already stretched site coordinators. Low-bandwidth dashboards and quick-reference SOPs make real-time monitoring feel manageable rather than burdensome.
11. Validate Systems and Processes Like GxP Work
Fast data that isn’t validated becomes an inspection risk. Treat real-time monitoring infrastructure the same way you’d treat any GxP-critical workflow. Validation artifacts should cover a User Requirements Specification (URS), risk assessment, test scripts, and a traceability matrix. Change control applies to KPI edits, threshold adjustments, and dashboard redesigns. Version control for calculated fields matters more than many teams realize until an inspection query arrives.
12. Add AI as Decision Support, Not a Replacement
AI is most useful as a decision-support layer: anomaly detection for site behavior outliers, dropout risk flags, and query prioritization are practical entry points. Monitor model drift and false-positive rates over time, and require explainability for any model that influences a monitoring decision.
AI works best when it helps a trained reviewer triage faster, not when it replaces the review. Start narrow, build governance first, and expand only after you can document what the model is doing and why.
Fewer Surprises, Not Just Faster Data
Real-time monitoring works when you define latency expectations, focus on CTQs, connect data sources, tune alerts for action, and align everything with RBM and GCP compliance. Yes, integrations and validation take effort, but the alternative is waiting weeks to notice patterns that could have been fixed in days. The goal was never to get more data faster. There were always fewer surprises later.
If you want help selecting your first CTQ metrics, writing real-time monitoring procedures for your Monitoring Plan, or designing alert rules that won’t overwhelm your team, reach out. Share your study phase, data sources, and biggest current bottleneck, and we’ll suggest a practical starter setup.
Real-Time Data Monitoring Questions Answered
1. What is real-time data monitoring in clinical research?
Real-time data monitoring in clinical research is the continuous or near-continuous review of trial data from EDC, ePRO, labs, and wearables so teams can detect safety signals and operational risks significantly earlier than periodic review cycles allow.
2. How does real-time data monitoring work in a clinical trial?
Data flows from source systems through integrations into a standardized layer, often mapped to CDISC structures. Automated checks run, alerts fire based on defined rules, and role-based dashboards refresh on a scheduled cadence for monitor review.
3. Why is real-time monitoring important in clinical trials?
It shortens the gap between “something happened” and “we responded,” which improves safety escalation, reduces late queries, strengthens protocol adherence, and lets teams course-correct before a struggling site derails an entire study timeline.
4. What are the main benefits and drawbacks of real-time monitoring?
Benefits include earlier safety detection, faster data cleaning, and stronger RBM support. Drawbacks include integration effort, alert fatigue risk, validation overhead, and the need for careful statistical planning if efficacy data is visible to blinded teams.
5. How do you prevent real-time monitoring from creating alert fatigue?
Set severity tiers, assign owners with defined response times, tune thresholds during a pilot phase, and track the percentage of alerts that result in a documented action. Remove any alert that doesn’t consistently drive a response.