

A nurse moves quickly through a busy ICU, manually checking charts while a patient’s vitals silently begin to decline. By the time the team reacts, precious minutes are already gone.
Healthcare generates 30% of the world’s data, yet most of it arrives too late to matter clinically. Real-time patient data dashboards are changing that, giving care teams instant, unified visibility and the ability to respond before a situation becomes a crisis.
The Problem With Healthcare Data Has Never Been Volume, It’s Timing
Hospitals have always been data-rich environments. Lab results, vital signs, EHR entries, wearable streams, and imaging reports all generate enormous volumes of information every single day. The problem was never the amount of data. It was always the delay.
Batch-processed reports, siloed systems, and manual chart reviews created a dangerous lag between what was happening with a patient and what a clinician actually knew. That gap, measured in minutes or hours, has real consequences in high-acuity settings. Think of it as the difference between a rearview mirror and a live GPS. You’re no longer reacting to where you’ve been; you’re seeing what’s happening right now.
Healthcare data dashboards are closing that gap permanently by continuously ingesting, processing, and displaying patient information as it happens. That shift from reactive to proactive monitoring is the real story here, and it’s reshaping care delivery at every level.
What “Real-Time” Actually Means and Why Getting This Wrong Is Dangerous
Not every vendor uses “real-time” to mean the same thing. That distinction matters enormously when the setting is an ICU or emergency department where seconds determine outcomes.
True Real-Time vs Near-Real-Time vs Batch Processing
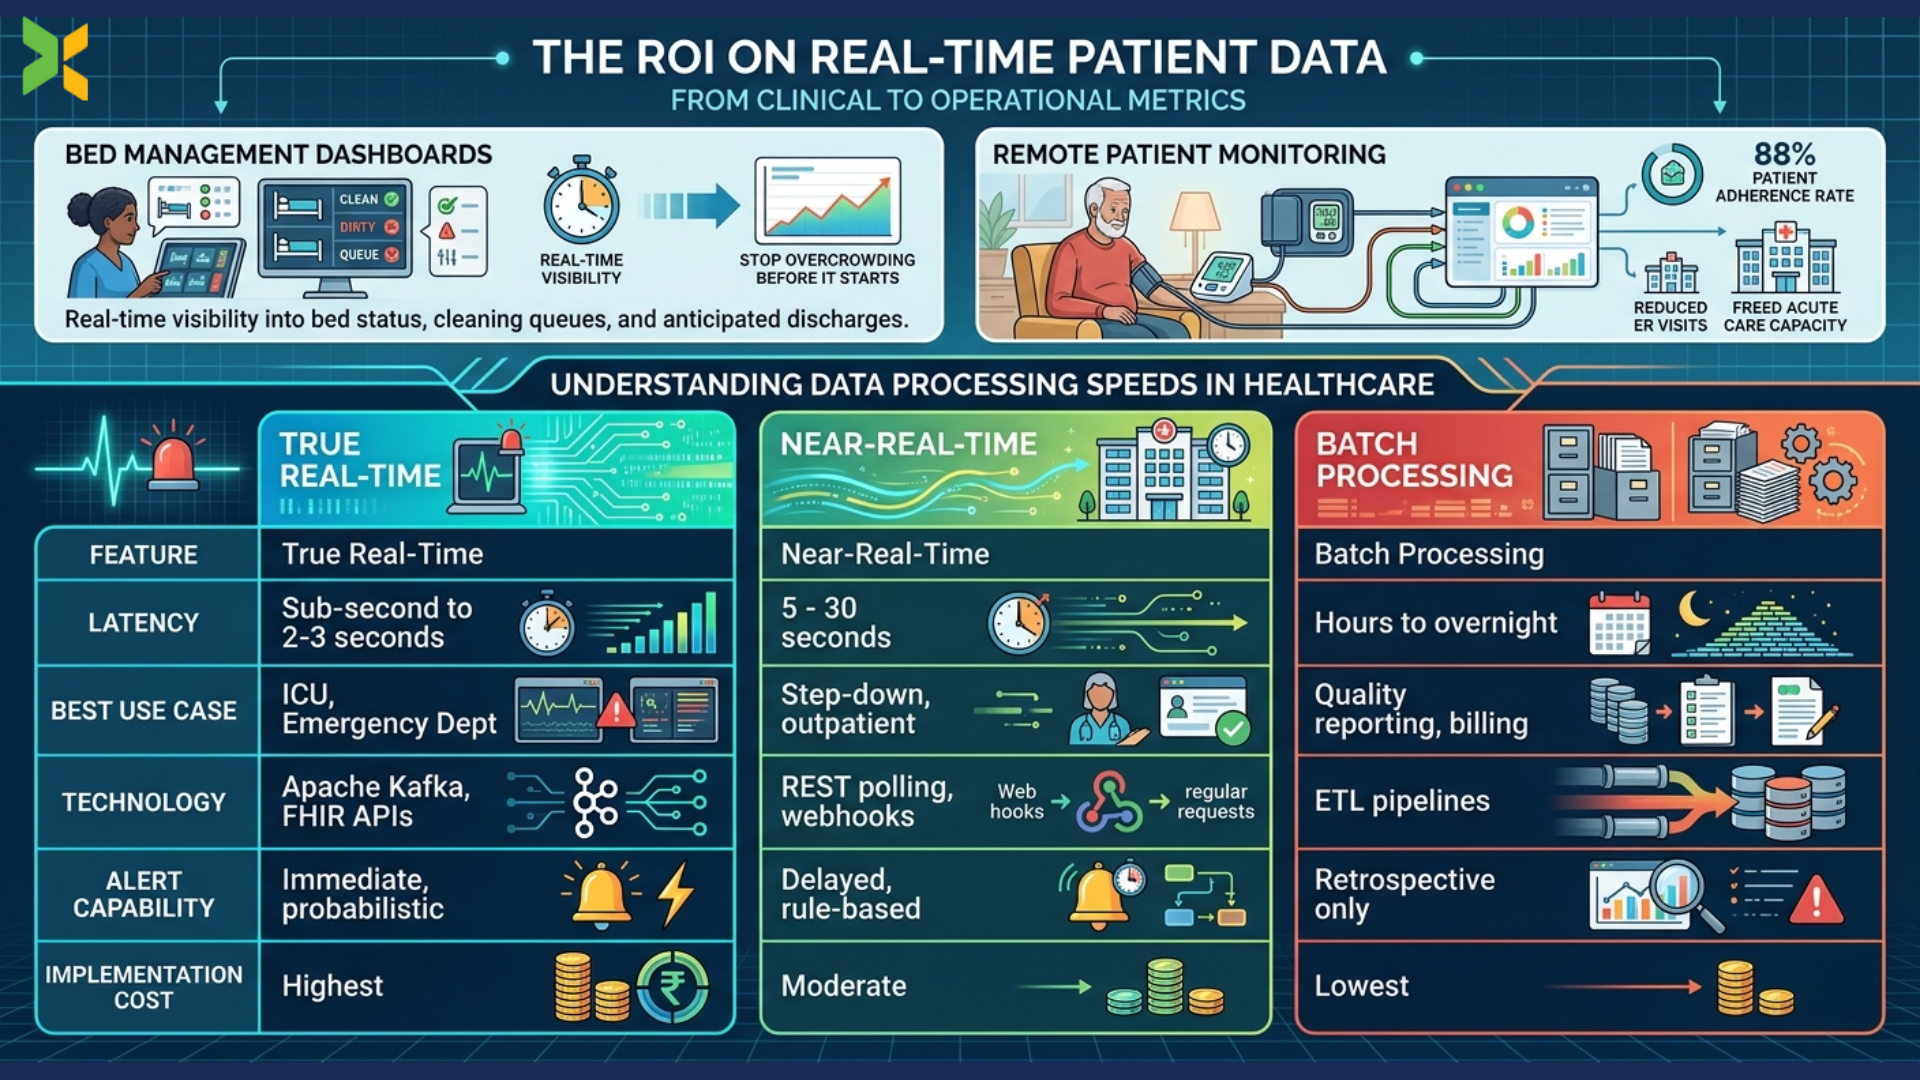
True real-time data streams continuously with sub-second to low-second latency. Technologies like FHIR-compliant APIs make this possible, processing vital signs and EHR updates the moment they’re generated. Near-real-time systems poll data every 5 to 30 seconds, which works reasonably well for outpatient scheduling or step-down units.
Batch processing aggregates and reports data in hourly or overnight cycles. That model may be acceptable for retrospective quality reporting. It’s not acceptable for sepsis detection.
Before you purchase anything, match the technology tier to the clinical use case. A batch system displaying the wrong oxygen saturation window in a critical care unit isn’t a minor inefficiency. That’s a patient safety problem that technology should solve, not create.
The Four Analytics Types Working Simultaneously
Real-time health data dashboards don’t simply show what’s happening. They support all four analytics types in one interface simultaneously:
- Descriptive analytics surface current vital trends and census data.
- Diagnostic analytics flag anomalies and surface probable root causes.
- Predictive analytics run early warning scores like NEWS2 and MEWS to anticipate deterioration.
- Prescriptive analytics recommend treatment adjustments based on patient-specific risk profiles.
When evaluating platforms, ask vendors specifically which of these four types their system supports and at what latency. The answer tells you far more than any polished product demo ever will.
How These Dashboards Actually Work, From Raw Data to Clinical Action
The mechanics are more accessible than most vendor pitches make them sound. First, the system ingests data from every relevant source, including EHR platforms and IoT medical devices. FHIR-compliant APIs and HL7 standards handle the connection layer, ensuring data flows securely and consistently.
Next, raw data from all those disparate sources gets normalized. This is where most implementations quietly fail. A lab value without its correct unit is clinically worthless. Timestamps misaligned across systems create false trend lines that can mislead clinicians entirely. Edge computing handles some of this processing at the device level, reducing both latency and the risk of transmitting corrupted data downstream.
Once normalized, machine learning models run against the clean data stream. These aren’t simple rule-based triggers. Modern systems assign probabilistic risk scores, flagging that a patient has a 78% likelihood of sepsis in the next six hours based on 47 variables simultaneously.
The final step is delivery through role-based dashboards, smart alerts routed by severity to the right clinician, and automatic documentation back into the EMR. All of it closes the loop so clinical response and data capture happen together, not separately.
The Benefits That Actually Show Up in Outcomes Data
The ROI on real-time patient data isn’t theoretical. Hospitals running continuous monitoring systems are seeing measurable improvements across both clinical and operational metrics.
Bed management dashboards give charge nurses real-time visibility into bed status, cleaning queues, and anticipated discharges, stopping overcrowding before it starts. Remote patient monitoring programs integrated with hospital data dashboards have achieved an 88% average patient adherence rate, meaningfully reducing unnecessary ER visits and freeing acute care capacity.
What Implementation Actually Looks Like, Including the Parts Nobody Warns You About
Breaking down data silos sounds straightforward until you’re staring at a 1998 patient management system with no API support and a vendor that went out of business in 2011. A 2024 HIMSS survey found that 70% of hospitals report significant data silos, and that number reflects the daily reality for most clinical informatics teams.
Alert fatigue is the silent killer of data dashboard ROI, and it starts before the system even goes live. Clinicians override up to 96% of alerts in poorly configured systems. That number should stop you cold. Threshold calibration isn’t a one-time setup task; it requires a dedicated 90-day audit cycle after launch to identify override patterns and recalibrate accordingly.
HIPAA compliance doesn’t stop at the data storage layer, either. A dashboard displaying a patient’s name, date of birth, and diagnosis on a shared screen in a busy nurse station may constitute a violation regardless of how securely the backend encrypts the data.
Role-based access control using RBAC frameworks and screen-level privacy audits aren’t optional extras. They’re foundational to responsible deployment.
Where This Is All Heading
The global RPM market, estimated at $14 billion in 2023, is expected to grow at 20.1% annually and reach $41.7 billion by 2028. That growth trajectory reflects genuine investment in hospital-at-home programs, wearable integration, and predictive analytics at scale.
Generative AI is already enabling conversational dashboard queries. A clinician types “show me all patients with a rising lactate trend in the last four hours” and gets an instantly filtered, visualized response.
LLMs are synthesizing full clinical summaries from structured and unstructured data in seconds, surfacing diagnoses and care gaps that would otherwise require manual record review. Edge computing is reducing both latency and the PHI attack surface simultaneously. The platforms being built right now will look as different from today’s dashboards as a live GPS looks from a printed paper map.
The Real-Time Shift That Healthcare Can’t Afford to Skip
Real-time patient data isn’t a feature upgrade anymore. It’s the infrastructure separating proactive clinical care from reactive crisis management. The organizations getting this right aren’t necessarily the largest or the best-funded; they’re the ones that picked a specific clinical problem, built around it, measured everything, and scaled with their frontline teams fully invested.
Start by running a FHIR compatibility assessment at hl7.org against your current systems. That single step will tell you more about your true readiness than any vendor demo ever could.
Common Questions About Real-Time Patient Data Dashboards
1. What is the difference between real-time and batch processing in healthcare settings?
Real-time systems stream data continuously with sub-second latency. Batch systems deliver data in scheduled cycles, sometimes hours apart. For ICU and ED settings, that delay is clinically unacceptable. For billing and quality reporting, batch processing remains a reasonable option.
2. Can smaller or rural hospitals realistically access real-time dashboard technology?
Yes, genuinely. Open-source tools like Grafana combined with InfluxDB, plus federally mandated FHIR-compatible EHR APIs, give resource-constrained facilities a viable starting point. The FCC Connected Care Pilot Program also provides dedicated funding for rural and safety-net organizations.
3. How long does a real-time dashboard implementation typically take from start to go-live?
A focused single-use-case pilot, such as ICU early warning monitoring, can reach go-live in 8 to 12 weeks with an experienced integration team. Facility-wide deployments typically require 6 to 18 months, depending heavily on legacy system complexity.